Within the healthcare environment, epidemiology data is a vital resource, informing and shaping many crucial decisions. The epidemiology of a disease forms part of its basic description and can inform on the cause of the disease as well as risk factors that influence its development within certain populations. This data is the foundation for decisions ranging from the development of pharmaceutical products to the intricate design of public health programs. In this article, Kris Barker, Senior Implementation Director at J+D Forecasting, delves into the nuances of epidemiology data, unravelling its definition, importance, and interpretation, and introduces EpiCube, J+D’s epidemiology database.
Defining epidemiology data
At its core, epidemiology data revolves around the occurrence and distribution of health patterns and diseases within specific geographic regions. The significance of this data lies in its ability to quantify the unmet need, inform clinical trial designs, aid in commercial planning, and contribute to health economics and outcomes research.
This essential resource helps to ensure that decisions within healthcare are not only informed but impactful. In a sector where time constraints and limited resources are significant challenges, ignoring the need for or quality of epidemiology data can lead to ill-informed decisions, wasting both time and resources. More importantly, these decisions impact on patients’ lives which makes data accuracy even more vital.
The use of epidemiology data for healthcare strategies can be looked at from two levels:
1. Macro Strategic Level:
Where governmental and national organizations leverage epidemiology data for policymaking. The data aids in assessing, tracking, trending, monitoring, predicting, and preventing health issues. This strategic application was particularly evident during the COVID outbreak, where epidemiology data played a crucial role in informing decision-making processes.
2. Micro Operational Level:
Individual pharmaceutical companies rely on epidemiology data, especially in new product planning/asset valuation, to forecast the potential utilization of their drugs. Here, epidemiology data serves as a valuable tool for making company-specific considerations, informing decisions, and strategic planning.
Why disease prevalence matters
The significance of knowing and understanding the patient numbers associated with a particular disease or health state is multifaceted. At its core, this process is pivotal for market estimation, delineating the potential costs, and forecasting the size of the potential opportunity from meeting the unmet patient need. However, having ready-to-use datasets tailored to these requirements is a rarity. More often than not, the estimation of such data or seeking reputable vendors for data acquisition is involved.

The ideal outcome is a reliable, comprehensive and robust data source that is able to present the resulting epi data in a way that aligns with the specific needs of the user. For example, the number of patients with a specific condition in a given year and location (e.g., 2019 in France). Additionally, a time-series dataset spanning multiple years, is generally required. This is the fundamental basis and starting point for any pharmaceutical market forecast.
Types of epidemiology data essential for pharmaceutical forecasting
1. Incidence and Prevalence:
Incidence and prevalence data form the foundational elements, offering insights into the occurrence and persistence of specific health conditions. Understanding these aspects is crucial for forecasting purposes, providing a baseline for market estimations (sizing the market).
2. Patient Subgroup Data:
Delving deeper, patient subgroup data involves categorizing patients based on factors like disease severity. For instance, in conditions like psoriasis, patients may be classified as mild, moderate, or severe, with further distinctions based on affected body surface area. This micro-level detail becomes particularly valuable when focusing on specific subgroups for forecasting.
3. Biomarker Positivity Rates:
This is an increasing element in oncology, where new assets are targeting very specific characteristics. Often, access and reimbursement is conditional on evidencing the presence of a particular biomarker, such as BRCA1 or PDL1, so understanding the positivity rates becomes indispensable.
4. Treatment Rates:
Epidemiology data related to treatment rates provides insights into the volume of patients undergoing treatment. This information allows a closer examination of how many patients receive treatment and the dynamics within this specific subset.
Epidemiology data collection methods and limitations
Data Assumptions
One of the primary challenges is the tendency to assume the adequacy of epidemiology data without questioning its relevance to specific markets, diseases, or patient subgroups. Forecasters may encounter difficulties if the data is accepted as a given fact without a critical evaluation of its suitability.
Example data analysis matrix
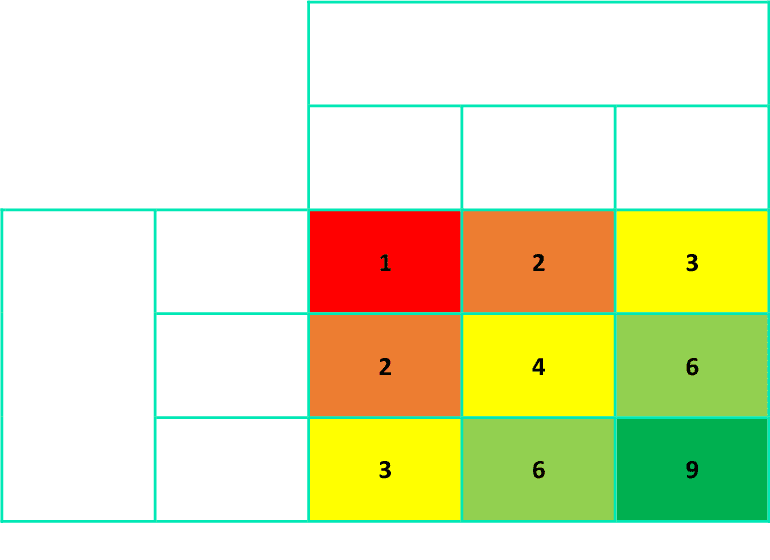
Key
Level 9: Highest quality, good sources, majority of countries & sub-populations covered, data for internal & external validation of figures
Level 1: Poorest quality, data scarce, heavy reliance on modelling to generate overall estimates, no external validation of figures
Familiarity and Review
Lack of familiarity with data for a specific group can pose challenges in identifying potential issues. In such cases, using a review checklist becomes essential to assess the data’s construction, analysis, sources, and adherence to guidelines.
Example checklist
-
Disease definition and guidelines
Have the key drivers of the disease been clearly understood and incorporated into the epidemiology? -
Disease knowledge and expertise
What guidelines and diagnostic criteria have been used? -
Country specific information
Have country specific sources and information been used to generate the datasets? -
Recent sources
Have recent sources of information been used to generate the datasets? -
Documentation
Does the provider document this information clearly? -
Fit for purpose
Is the data appropriate for what you intend to use it for?
Interpretation of Numbers
Misinterpretation may arise from not being clear on how numbers are presented, whether in absolutes, thousands, or millions. Being aware of the unit of measurement is crucial. If the analyst is unsure or makes incorrect assumptions about the underlying filter for the percentages it may lead to miscalculations, producing inflated or underestimated figures. For instance, if the percentage indicates that 50% of patients are treated, it’s important to clarify whether it refers to 50% of prevalent patients, diagnosed patients, or a specific sub-group of patients.
Confidence in Data Sources
Building confidence in the data involves a thorough understanding of the analysis, weaknesses, and justifications for its use. Pharma companies may consider purchasing data from multiple vendors or requesting proposals from various suppliers to compare and choose the most reliable dataset. Confidence is essential to gain internal stakeholder trust in the dataset selected.
Forecasting the future
Expectations for the future of epidemiology data include improved data collection and analysis, driven by advancements in technology and emerging research areas.
Notably, artificial intelligence (AI) is poised to play a pivotal role, expediting clinical trials and making them more efficient, reliable, and effective. We expect to see AI’s application in difficult-to-reach areas where data is scarce, leveraging clinical trials and other sources to address gaps. With AI tools having the potential to minimize common challenges in data interpretation, forecasters benefit from a more streamlined and reliable approach.
Additionally, a potential surge in national data sets is foreseen, spurred by lessons learned from events like the COVID pandemic, prompting countries to invest in robust monitoring systems for better disease tracking and response capabilities. This collective effort is expected to enhance the overall quality and availability of epidemiological data globally, paving the way for more efficient and reliable forecasting.
Choose EpiCube for efficient, error-free data analysis
Through the dynamic capabilities of Power BI, Microsoft’s analytical and visualization software, you can explore epidemiology data effortlessly with EpiCube. Filter down into disease-specific details, conduct micro and macro-level analyses, whether by year, gender, country, or biomarker positivity rates. EpiCube’s coverage includes 250 diseases, and nearly 10,000 subpopulations across 50 markets, extending comprehensively to oncology forecasting, with over 30 tumour types. This serves as a valuable tool for both secondary and primary market research. EpiCube already offers enhanced data capabilities and promises to evolve as advancements in AI continue, allowing users to explore epidemiology data effortlessly.

Author: Kris Barker, Senior Implementation Director at J+D Forecasting.
Expertise in both forecasting and quantitative and qualitative market research projects across multiple therapy areas, gained over the last 15 years.
Author: Kris Barker, Senior Implementation Director at J+D Forecasting.
Expertise in both forecasting and quantitative and qualitative market research projects across multiple therapy areas, gained over the last 15 years.
Speak with an expert.